
Business Intelligence & Analytics
Business Intelligence and Analytics Agency for Systems
Most businesses have plenty of data but lack the infrastructure to use it. Voxturr builds the pipelines, dashboards, and models that turn raw data into real-time intelligence your teams actually act on.
The Challenge Is What Happens After You Collect The Data
In 2026, almost every business generates more data than it can act on. The gap is connection, interpretation, and activation. Data that lives in separate systems and gets compiled into a spreadsheet once a week is reporting. It is archaeology.
- Marketing, sales, finance, product, and operations data unified into a single intelligence layer
- Actionable insight surfaces in real time, faster than any weekly spreadsheet compile
- The right response triggers automatically, or through a dashboard any team member can read on their own



What BI And Analytics Looks Like In 2026
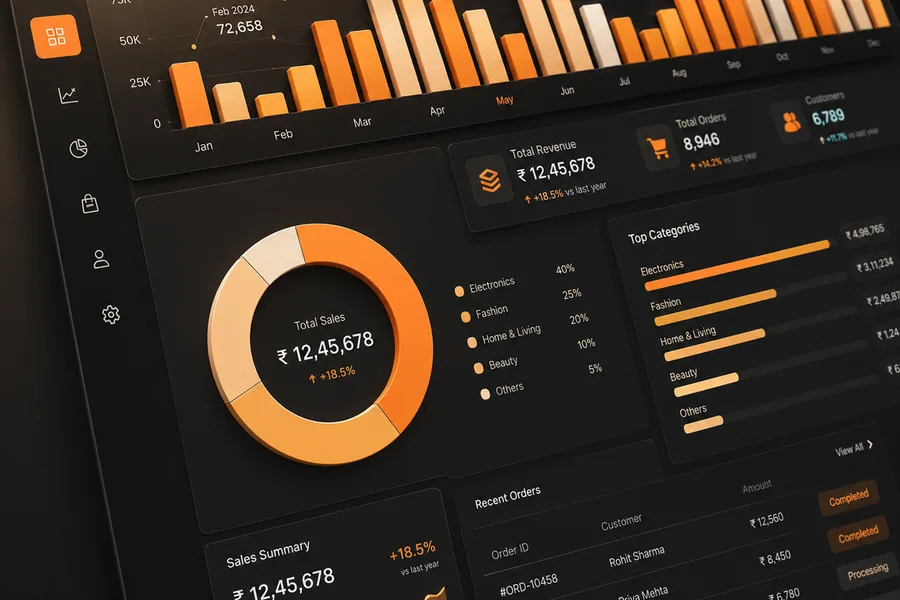
Descriptive reporting is the floor, not the ceiling. The companies pulling ahead are operating with predictive and prescriptive intelligence. Here is the maturity curve, and where most of our engagements sit.
Descriptive Analytics: What Happened
Level 1The foundation. Accurate, connected reporting across channels and departments so leadership has a single, reliable view of performance without spending time compiling it. For most businesses, getting this right is the most impactful thing they can do with data. We connect every source, marketing platforms, CRM, finance systems, ecommerce, product databases, into clean, real-time dashboards any stakeholder can access.

Diagnostic Analytics: Why It Happened
Level 2The next step up. Once the numbers are trustworthy, the question becomes why they moved. We build the drill-down paths, segmentation, and root-cause views that let teams trace a change in a metric back to the channel, cohort, or campaign that caused it, without waiting on an analyst to run the query.
Predictive Analytics: What Will Happen
Level 3Where analytics starts to compound. With clean historical data in place, we build models that forecast revenue, predict churn, score leads, and anticipate demand, so decisions are made against where the business is heading rather than where it has already been.

Prescriptive Analytics and AI-Assisted Intelligence
Level 4The frontier. Beyond predicting what will happen, the system recommends what to do about it. AI-assisted insight surfacing, anomaly detection, and next-best-action guidance built directly into the dashboards your teams already use, turning intelligence into action automatically.

Every Layer Of The Analytics Stack, Service By Service
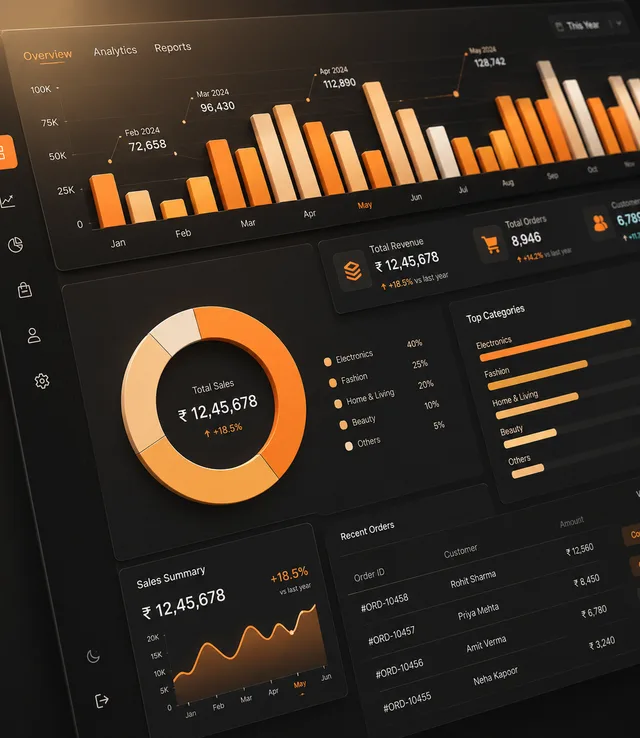
From the data pipelines underneath to the AI models on top, here is the full scope of what we build.









Data Without Infrastructure Is Just Noise
The distance between “we have data” and “we have intelligence” is a properly architected pipeline, a clean warehouse, and dashboards built around the decisions your teams actually make. That is the distance we close.
See How We WorkThe Full Modern Analytics Stack
We are tool-agnostic. The recommendation is based on your data volume, your team, and the analytical use cases your business requires.


The Analytics Build Process, Start To Finish
A structured process that starts with the decisions you need to make and builds backward from there to the data infrastructure that supports them.
Analytics Audit and Requirements Discovery
We understand what decisions the business needs to make, what data exists, where it lives, and the gap between what is currently reportable and what leadership actually needs. For existing infrastructure, this includes a technical audit of tracking, pipeline health, and dashboard utilisation.
Data Architecture Design
We design the architecture: source systems, pipeline topology, warehouse schema, and the semantic layer between raw data and business-facing dashboards. Reviewed and approved before build begins, ensuring the infrastructure matches the data volume, team size, and analytical use cases.
Pipeline Build and Data Integration
We build the pipelines that move data from every source system into the central warehouse, clean, transformed, and consistently structured. Off-the-shelf connectors where they exist, custom integrations where required.
Dashboard and Report Development
Built against the data model, designed for the specific audience and decision context of each view. Every dashboard goes through a review cycle with the business stakeholder before deployment, ensuring it answers the questions it was built for.
Training and Self-Serve Enablement
We train teams on how to use, interpret, and extend the dashboards. Where self-serve is in scope, we build the governed data environment and train business users to explore independently.
Ongoing Monitoring and Evolution
New data sources, changing business questions, model drift, and tracking implementations that break when the product changes. We provide ongoing support to keep the infrastructure accurate, relevant, and aligned with how the business is evolving.
Data Work That Moved the Number
Real numbers from analytics-led programmes across health, e-commerce, and enterprise finance.
Want to see what more we’ve worked on?
View All Case StudiesWhy Companies Choose Voxturr For BI And Analytics
What separates full-stack, decision-oriented analytics from a dashboard somebody built and nobody uses.
Traditional Agency
With Voxturr
Built For The Companies Where Data Should Be Driving Decisions
From product-led SaaS companies to enterprise teams replacing spreadsheet-based reporting with real infrastructure.
SaaS and Product Companies
Product analytics, user behaviour analysis, funnel optimisation, feature adoption measurement, and churn prediction. The data that drives product decisions and growth experiments.
Ecommerce and D2C Brands
Marketing attribution, customer LTV and cohort analysis, channel performance reporting, inventory analytics, and real-time revenue dashboards across D2C and marketplace channels.
Fintech and Financial Services
Revenue analytics, compliance reporting, risk model monitoring, customer health scoring, and financial performance dashboards built to the accuracy standards financial services requires.
Healthcare and Healthtech
Patient or user behaviour analytics, clinical outcome measurement, operational efficiency dashboards, and implementations that meet data privacy and compliance requirements.
Enterprise and Mid-Market
Cross-functional BI that connects finance, sales, marketing, operations, and HR data into a unified reporting environment, replacing the spreadsheet-based reporting that currently occupies someone’s Monday morning.
Growth-Stage Teams
If your decisions should be driven by data and currently are driven by instinct, we build the infrastructure that closes the gap, at whatever scale and budget your stage requires.
Frequently Asked Questions
Business intelligence is the infrastructure and reporting layer: the pipelines, warehouses, and dashboards that make data visible and accessible. Business analytics is the interpretation layer: analysis, modelling, and insight generation that answers the why behind what the data shows. Most organisations need both, built in sequence. We build both.
Platform-native dashboards are useful within their domain, but they cannot connect data across systems, answer cross-functional questions, or provide the unified view leadership needs for strategic decisions. The gap between “we have dashboards” and “we have intelligence” is the gap between single-system reporting and a properly architected BI layer that connects everything.
A basic unified reporting dashboard connecting two or three source systems can be live in two to four weeks. A full cross-functional BI infrastructure with custom data pipelines, predictive models, and self-serve capability is typically a two to four month build, delivered iteratively with the highest-value dashboards deployed first.
We work with your existing tools where they are the right fit, and recommend changes where they are holding you back. Our first step is always an audit of what you have. We do not replace tools for the sake of it. The goal is a stack that does the job, suited to your data volume, team, and use cases.
Yes. Predictive models for churn, lead scoring, revenue forecasting, and demand prediction can be built on top of your existing data and integrated into the dashboards your teams already use. The prerequisite is clean, well-structured historical data, which the audit will assess.
We review your current tracking implementations for accuracy and completeness, assess pipeline health, evaluate dashboard utilisation and whether existing reports answer the questions they were designed for, and identify the highest-priority gaps. The output is a prioritised roadmap with clear recommendations and expected impact for each.
Turning Ideas into Market Success
Explore how innovative strategies can be positioned, marketed, and scaled to achieve real-world growth and impact.
-
 5 min read
Analytics Agency vs. In-House Team: Which is Right for Your Business?
In 2024, as data analytics becomes more integral to business success, companies can access advanced tools like Google Analytics 4 (GA4), which helps e-commerce platforms…
Written By
Posted On
Updated
-
 6 min read
Copywriting Secrets Freelance Copywriters Use to Grab Attention
In the fast-paced digital landscape of 2025, where attention spans are shorter than ever, the art of capturing a reader’s interest is paramount for…
Written By
Posted On
Updated
-
 9 min read
Ansoff Product Market Matrix – In Age of Digital Businesses
The Ansoff Matrix, developed by Igor Ansoff, is one of the most valuable frameworks for strategic planning, helping businesses identify growth opportunities through a…
Written By
Posted On
Updated
-
 11 min read
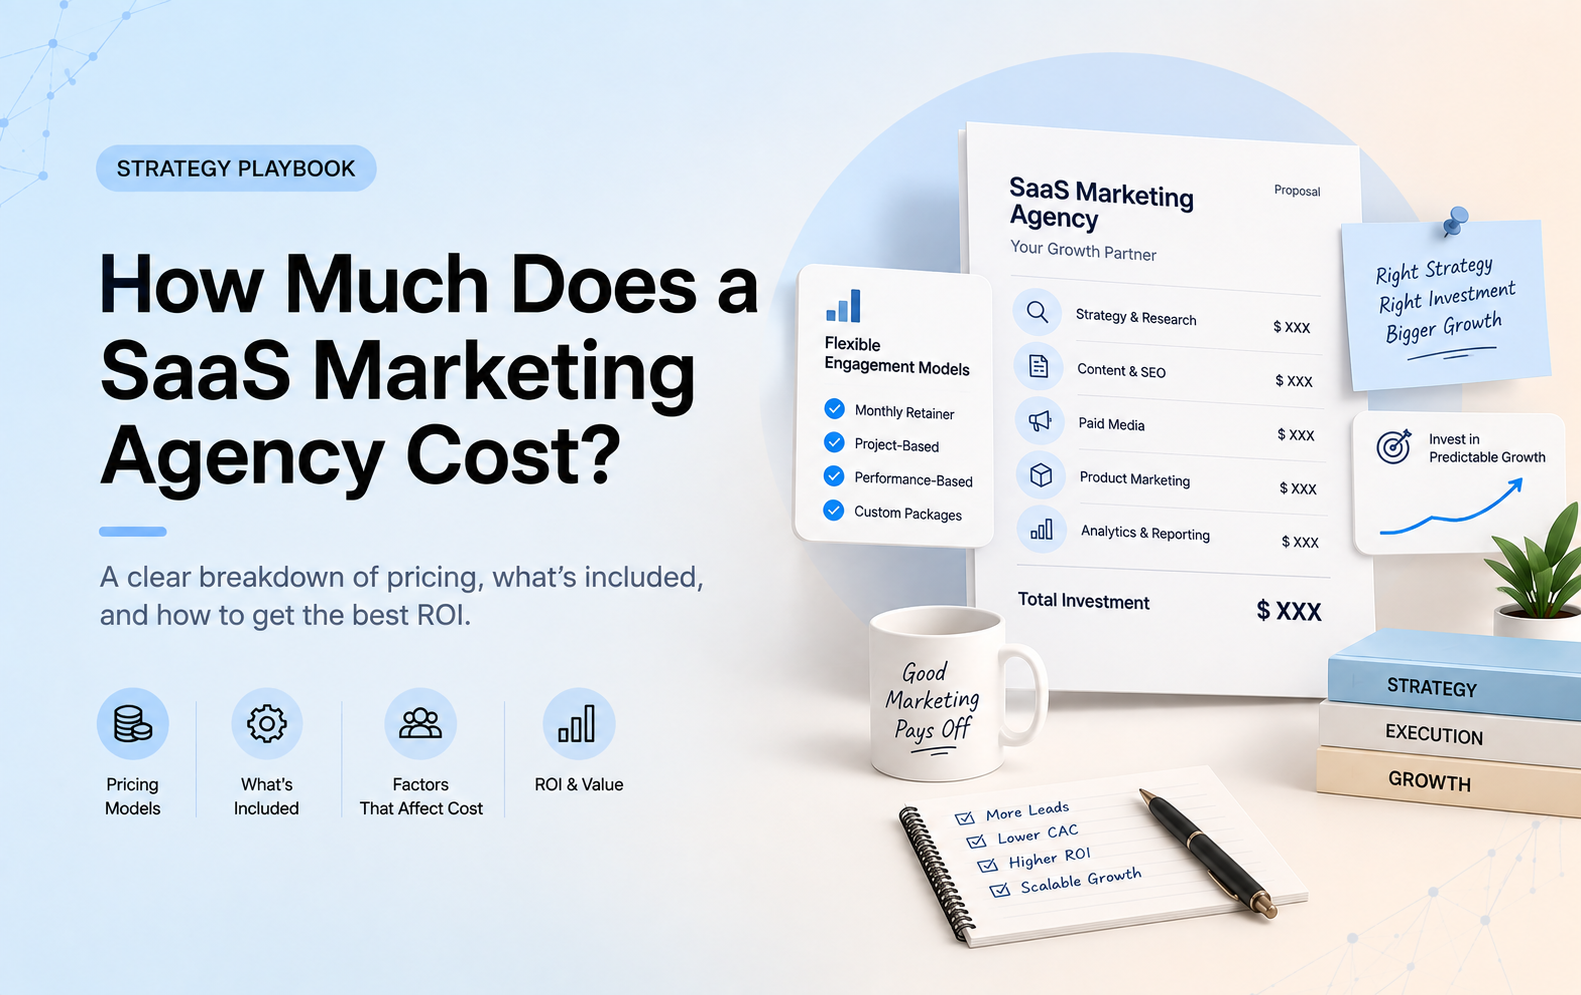
How Much Does a SaaS Marketing Agency Cost?
Having worked with 150+ brands, we’ve built this guide around the questions companies and startups ask most often when evaluating SaaS marketing investments. It…
Written By
Posted On
Updated
-
 4 min read
Do Webinars Help Close High-Ticket Clients in a Strict ABM List?
How Webinars Help Close High-Ticket Clients Getting in touch with high-value prospects in today’s SaaS world isn’t just hard; it’s almost tiring. Direct outreach…
Written By
Posted On
Updated
-
 9 min read
AI-Driven eCommerce Features For Website and Mobile Apps
By 2024, AI has become deeply integrated into eCommerce, with its influence extending to nearly every aspect of online shopping. From personalized product recommendations…
Written By
Posted On
Updated
-
 19 min read
10 Proven D2C Success Strategies for Sustainable Growth
D2C Success Strategies for Sustainable Growth If you are building a D2C brand in India right now, the market has never been bigger or…
Written By
Posted On
Updated
-
 5 min read
What is SEO Management? (with Complete SEO Website Audit hecklist)
Did you know? Organic search results currently account for more than half of all website traffic. Hence, Search Engine Optimization(SEO) is becoming more critical…
Written By
Posted On
Updated
-
 9 min read
Business on a Budget – Growth Marketing Tips That’ll Not Exhaust Your Startup Capital
More than 90% of the startups fail within the first 5 years of their inception, and close to 40% fail due to exhaustion of…
Written By
Posted On
Updated
Build An Intelligence Layer That Gives Every Team The Data They Need, When They Need It
The gap between businesses that grow compounding and businesses that plateau is often whether the people making decisions have accurate, timely, connected data, or whether they are working from last week’s export. Voxturr closes that gap. Tell us what decisions you need to make. We will show you how to make them with data.
Project Inquiries
Call Us
Our Offices
USA
71 Stevenson St, San Francisco, CA 94105, United States
India
427, TowerB3, Spaze iTech Park, Sohna Road, Sector 49, Gurugram, Haryana – 122002
Got a Project in Mind?
We care about your privacy, and therefore on submitting this form, we will send you a copy of the signed NDA. Also, by submitting this form, you agree to our T&C and privacy policy.